The Economic Value of Heritage
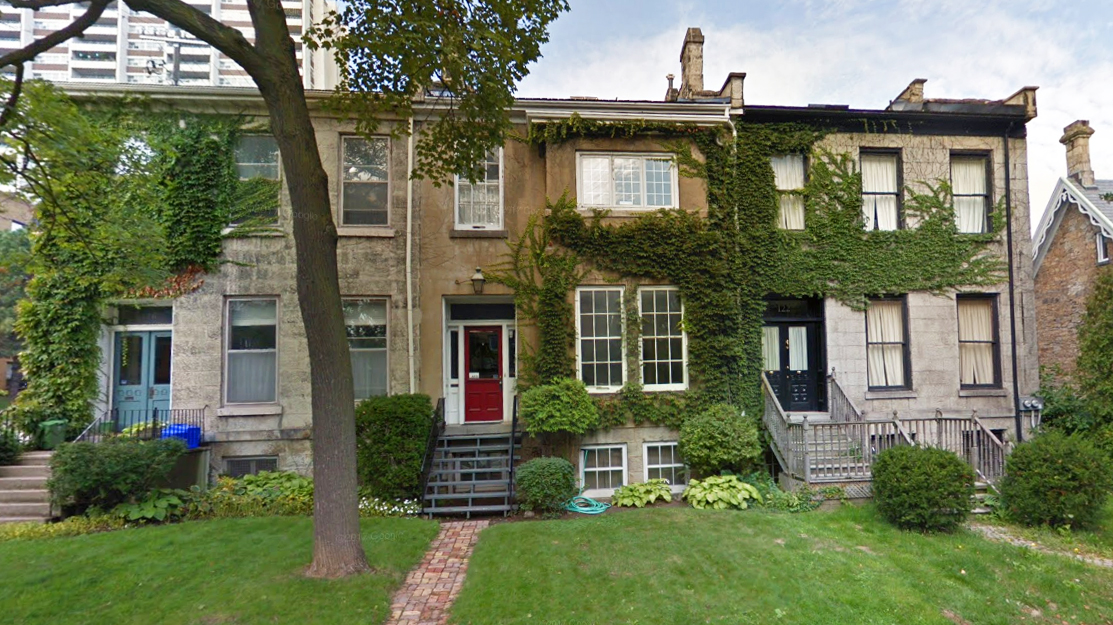
The value of heritage buildings is a hot topic in communities across North America. Many people value these buildings. They display style and workmanship that we often do not see with new buildings, and they connect us to our city’s history. They do much to establish the character of a street, and form the backbone of a community. However, this aesthetic and cultural value is often perceived as being at odds with economic value. There is a common belief that heritage designations reduce the value of properties. An analysis of heritage conservation districts (HCDs) in Hamilton, Ontario tests this belief.
Economic Value of Heritage Districts
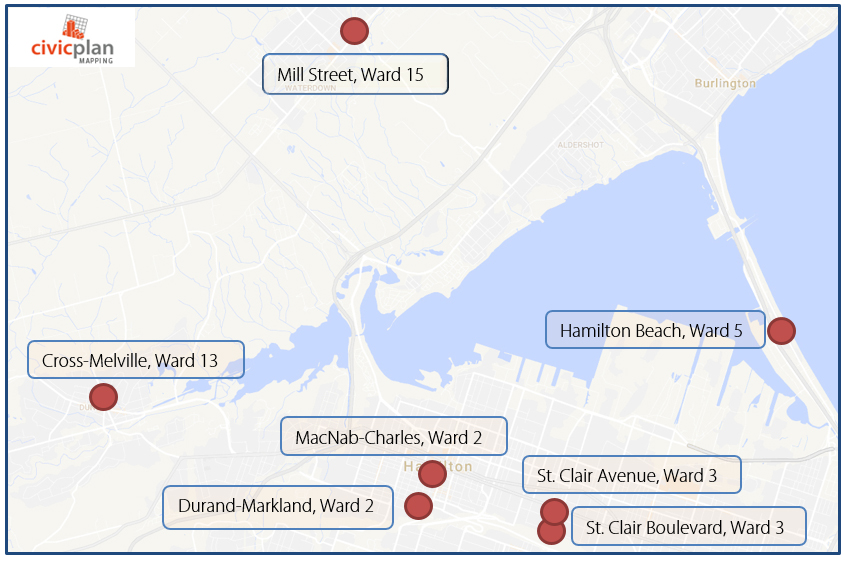
Civicplan’s Urban Insights Bulletin, The Economic Value of Heritage Districts, analyzes the assessed property values in HCDs in the City of Hamilton. Specifically, it compares the assessed value of properties within the City’s seven heritage conservation districts to the average assessed value for their respective wards. Also, these comparable values are evaluated over time, from 2010 to 2016, to see how assessment values may have changed. While assessed value can differ significantly from market value, it provides a consistent measurement to compare properties within the same community.
Between 2010 and 2016, the average assessed property value in Hamilton’s seven heritage conservation districts increased significantly. The average increase across all districts was 33 percent, with the highest increase in the Durand-Markland HCD (43%) and the lowest in the Cross-Melville HCD (25%). (see Table 1)
Table 1: Average HCD Property Value Assessment 2010 and 2016

To put these values in context, reviewing the assessed value of properties in HCDs and the average assessed values in their wards provides a useful comparison (see Table 2). Six of the seven HCDs have higher assessed values than the average assessment of the ward in which they are located. On average, HCD properties were valued at 87 percent more than their ward’s average. The only HCD with a lower average value than its surrounding ward is the Mill Street district in Waterdown. On average, properties in the Mill Street district were valued at just under 14 percent less than the ward average.
Table 2: Average 2016 Assessed Value of HCDs Compared to Average Ward Assessed Values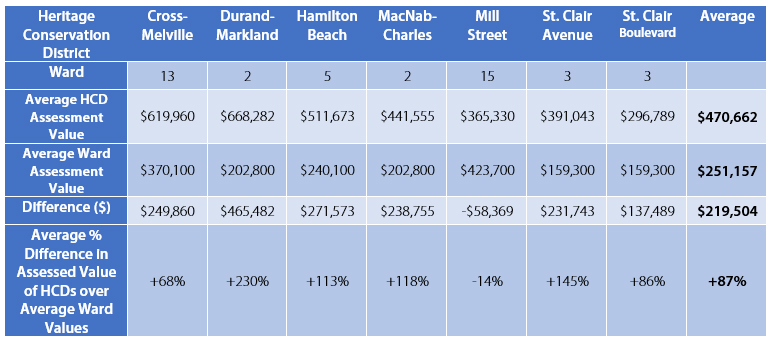
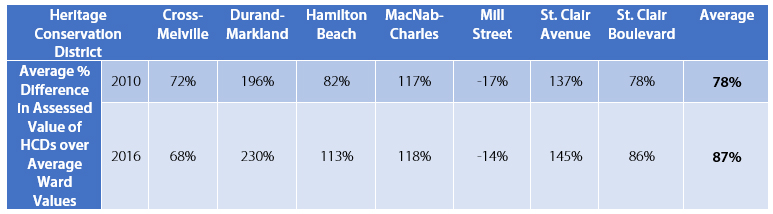
Between 2010 and 2016, all but one of the HCDs had greater average increases in assessed value than the average assessed values in their wards (see Table 3). In 2010, the average assessed value of Hamilton’s HCDs was 78 percent greater than their respective ward averages. By 2016, this difference had grown to 87 percent.
Table 3: Change in Average Value Difference between HCDs and their Ward 2010-2016
Conclusion
This analysis illustrates that Hamilton HCDs tend to be clusters of residential properties that are assessed at a higher value than their counterparts in the rest of the ward. Further, this value increases at a faster rate than the surrounding areas in the ward. Thus, it appears that heritage designation, in the form of a conservation district, does not negatively impact the value of properties. Rather, it may enhance value over time.
While the focus of this analysis was on assessed value of heritage conservation districts, it is important to acknowledge the local context of HCDs, as that may have additional influence on value. For example, the HCDs in this analysis tend to be located in areas with a stable stock of residential properties surrounding them. Further they tend to be in more affluent neighbourhoods within their respective wards.
While it is well understood that heritage designation contributes to the preservation of our past, it is also important to better understand how designation might assist with the retention of property value, thus helping to build a community’s economic future.